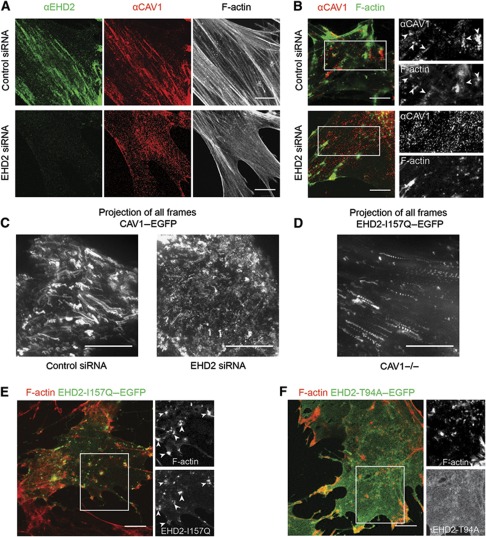
Figure 7.
EHD2 oligomers mediate a link of caveolae to F-actin. (A) Confocal images of primary human fibroblasts immunostained with EHD2 and CAV1 antibodies and stained with fluorescent Phalloidin to visualize filamentous actin. Cells were transfected with control siRNA or EHD2 siRNA. (B) Confocal images of human fibroblasts transfected with control siRNA or EHD2 siRNA and treated for 5 min with 5 μM CytoD. CAV1 and Phalloidin signal is depicted. Side panels show enlargements of indicated regions in the merged images. Arrowheads highlight CAV1 close to actin patches. (C) HeLa cells stably expressing CAV1–EGFP were treated with control siRNA or EHD2 siRNA and transfected with RFP–actin (not depicted). Image depicts the CAV1–EGFP maximum intensity projection of all frames of a 7.5-min TIR-FM movie (90 frames, frame rate 0.2 Hz, penetration depth 110 nm) starting upon addition of 5 μM CytoD. Distinct trajectories of caveolae moving in the PM plane due to actin retraction can only be seen in control conditions. (D) CAV1−/− cells were transfected with EHD2-I157Q–EGFP and RFP–actin (not depicted), treated with CytoD and live imaged as in C. (D) Maximum intensity projection of EHD2-I157Q–EGFP signal reveals retracting puncta. (E) Confocal images of CAV1−/− cells, transfected with EHD2-I157Q–EGFP, treated for 5 min with 5 μM CytoD and stained with fluorescent Phalloidin. Side panels show enlargements of indicated region in the merged image. Arrowheads highlight EHD2 close to actin patches. (F) Confocal images of CAV1−/− cells, transfected with EHD2-T94A–EGFP, treated and analysed as in E. All scale bars 10 μm.

