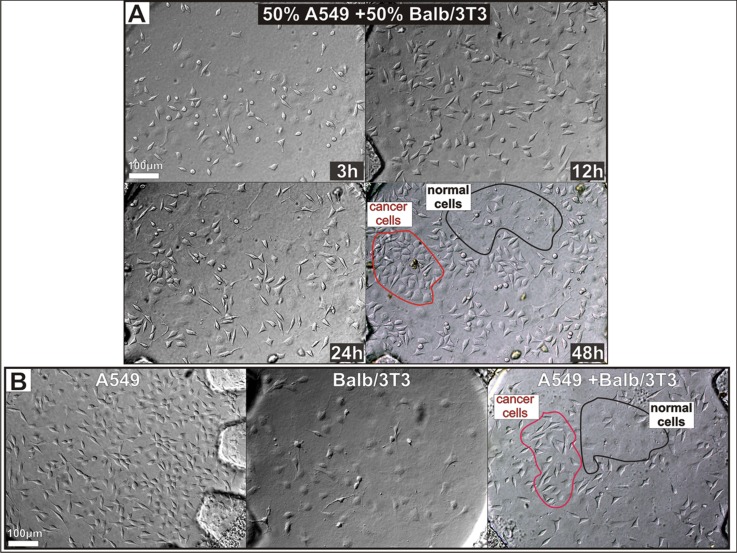
Figure 2.
The “mixed” culture growth. Balb/3T3 : A549 ratio is 50:50. The cells were monitored over time, and their migration was observed. Finally they created characteristic clusters. (b) The separated culture of A549 and Balb/3T3 cells, and the “mixed” culture of A549: Balb/3T3 cells. The separated Balb/3T3 and A549 are attached to the glass one by one, whereas “mixed” culture creates cluster between the cells in the same kind.

