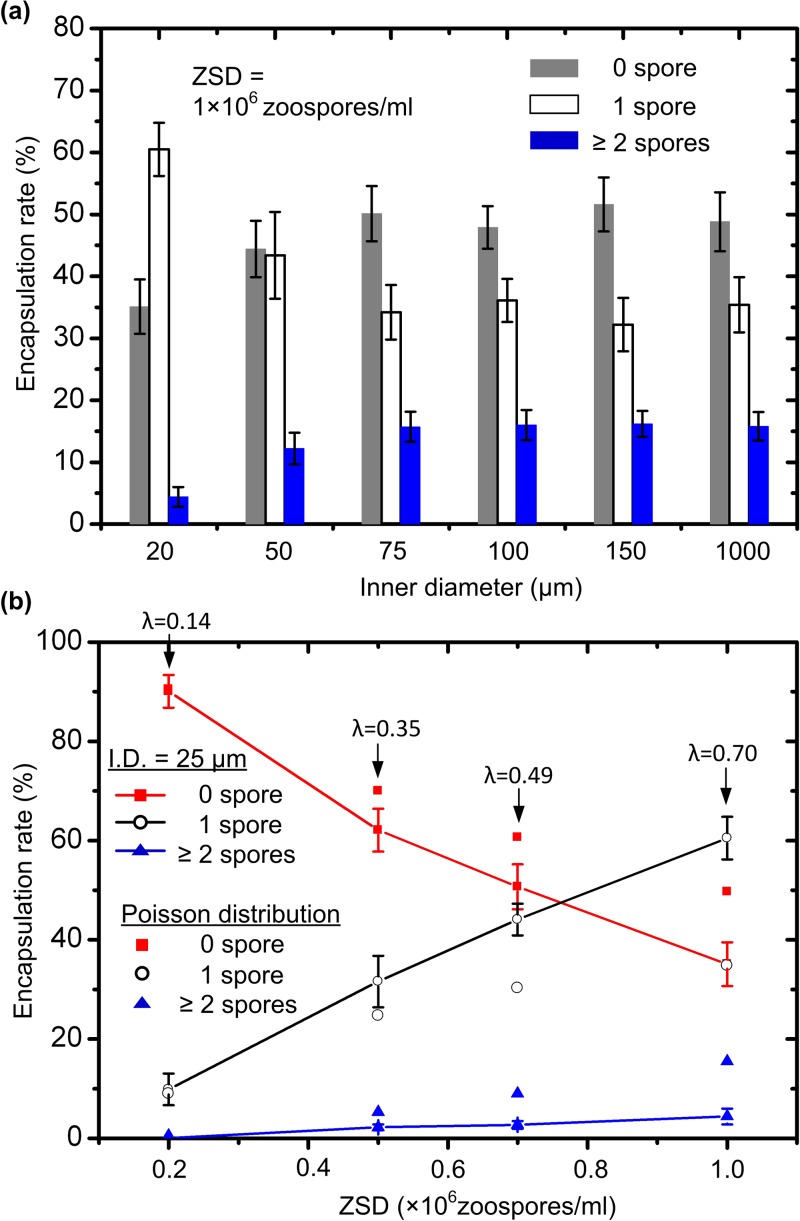
Figure 3.
(a) Encapsulation rate for 0, 1, and ≥ 2 zoospores in a droplet with respect to the inner diameter of the microtubing containing a zoospore suspension with ZSD = 1 × 10⁶ zoospores/ml. The zoospore-chemical flow rate used here was 0.008 ml/h and the oil flow rate was 0.02 ml/h. (b) Encapsulation rate for 0, 1, and ≥ 2 zoospores in a droplet as a function of the ZSD. The inner diameter of the microtubing was 20 μm and the oil flow rate was 0.02 ml/h. For comparison, the Poisson distribution of the number of zoospores in droplets were calculated. The value of λ shown in this figure represents an average number of zoospores per droplet if zoospores are uniformly distributed among all droplets.

