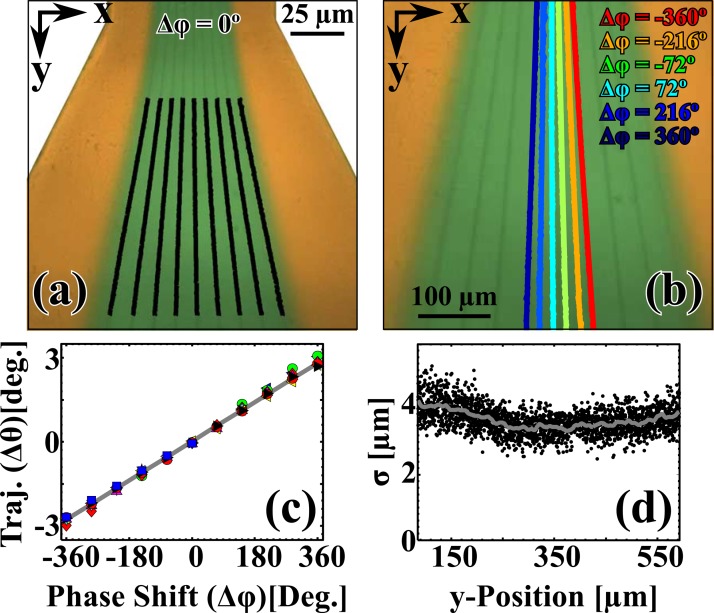
Figure 4.
(a) The expansion region of the device at Δφ = 0°. The solid black lines are the centroids of the Gaussian fits for each stream taken for each x-axis row of pixels. (b) A close-up of the expansion region at Δφ = 0°. The centroids of the Gaussian fits shown for the center-most bead stream as a function of phase (Δφ = {−360° (red), −216° (orange), −72° (green), 72° (cyan), 216° (light blue), and 360° (navy)}). (c) The change in trajectory (Δθ) as a function of Δφ. The different colored points are the collapsed data for the different streams. The solid gray line is the fit (Δθ(Δφ) ≈ −0.01 deg/deg). (d) The square root of the variance (σ) of the Gaussian fit shown as a function of the y-Position. The origin was taken at the beginning of the black lines in (a). The gray solid line was added to guide the eye.

