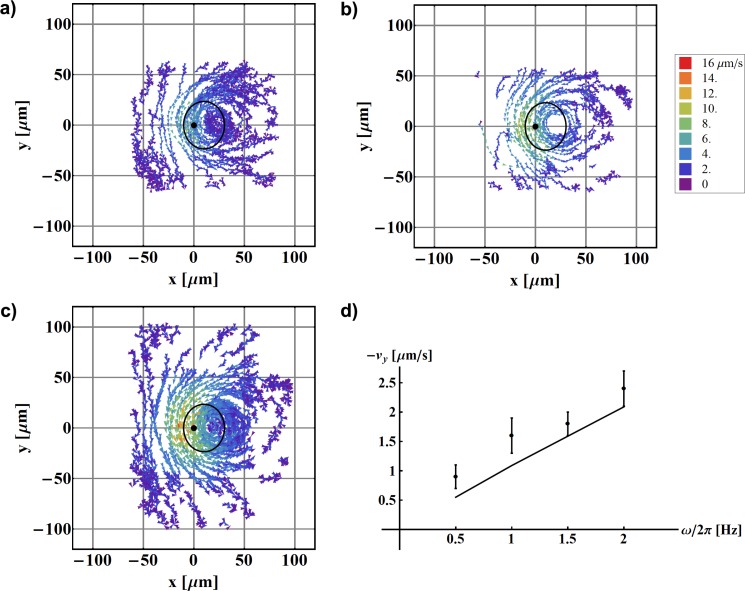
Figure 3.
Mapping of fluid flow around one beating artificial cilium as a function of rotational frequency. The cilium is fixed at (0,0) and the black solid line denotes the calculated path of the cilium tip. (a) ω/2π = 1 Hz; (b) ω/2π = 1.5 Hz; (c) ω/2π = 2 Hz. All other parameters remain the same: L = 30.8 μm, ψ = 49.6°, , z = 40 μm. (d) The measured average velocities in the pumping direction (dots) and predictions from the simulation (line). Both show linear dependence on ω.

