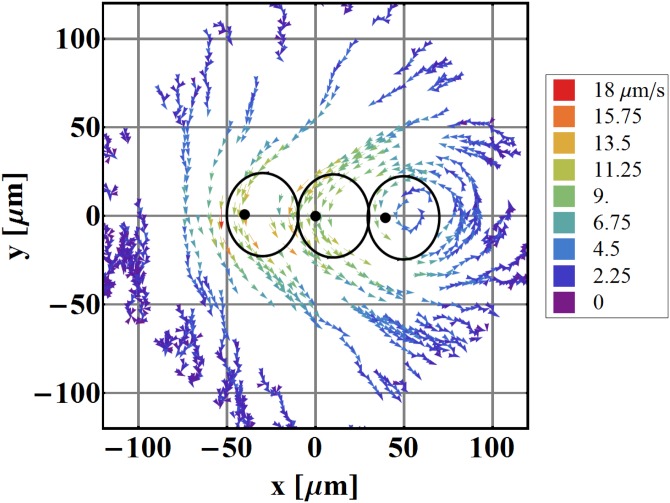
Figure 6.
Mapping of fluid flow around three linearly arranged artificial cilia. Black dots denote the anchoring sites and the solid lines the calculated paths of the tips of the cilia. ω/2π = 2 Hz; L = 30.8 μm, ψ = 49.6°, , z = 40 μm. The velocity scale is different than in other images due to larger pumping effects.

