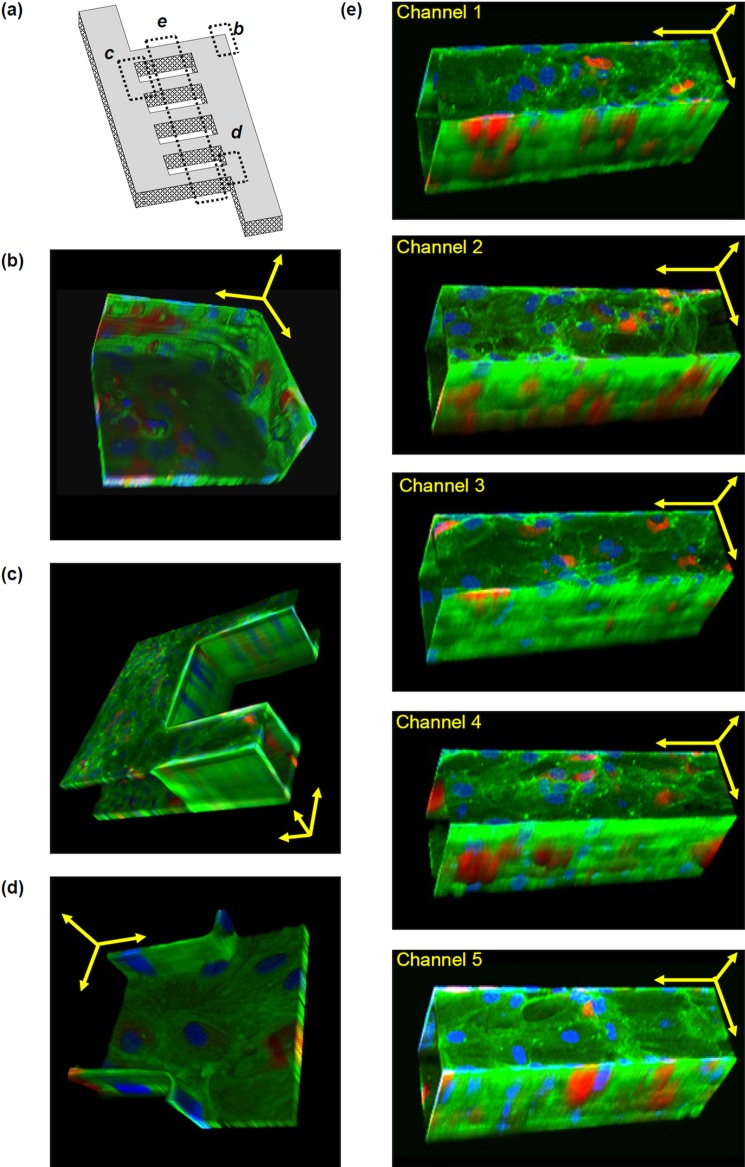
Figure 6.
Tilted 3D images of HUVECs at sections of the microvascular network. HUVECs were immunostained for von Willebrand factor (red), actin stress fibres (green), and nuclei (blue) and found to line all walls and corners of all channels. Von Willebrand factor is observed in all cells, but at different depths. Images only show von Willebrand factor at that plane of view. Since the 3D images are tilted, scale bars are provided only as estimation. Scale bars are shown as yellow arrows in x, y, and z axes. (a) Schematic to show where sections (b)-(e) are located on the overall network. (b) Corner of the network. Scale bar: 50 μm. (c) Between two channels. Scale bar: 100 μm. (d) Entrance into a channel. Scale bar: 50 μm. (e) Microchannels. Scale bars: 100 μm.

