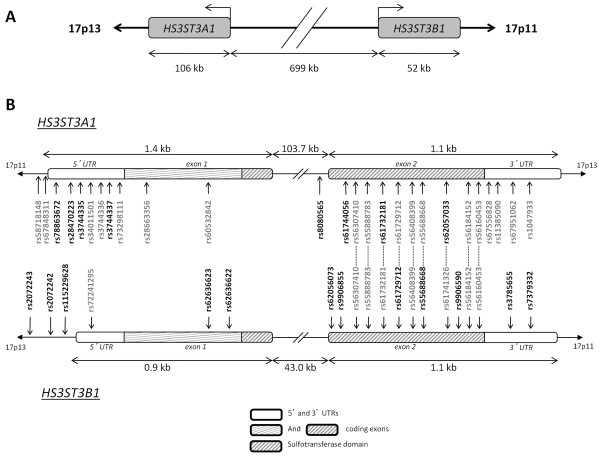
Figure 1.
(A) Diagram of the HS3ST3A1/HS3ST3B1 locus. (B) Location of the known SNPs in relation to the intron/exon structure of HS3ST3A1 and HS3ST3B1. The SNPs that were detected are in bold. The 5'- and 3'-UTRs are shown by white boxes and the coding exons are shown by hatched boxes. The regions that encode the sulphotransferase domain are shown.

