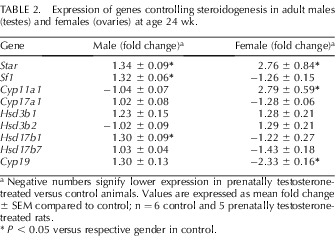
TABLE 2.
Expression of genes controlling steroidogenesis in adult males (testes) and females (ovaries) at age 24 wk.

a Negative numbers signify lower expression in prenatally testosterone-treated versus control animals. Values are expressed as mean fold change ± SEM compared to control; n = 6 control and 5 prenatally testosterone-treated rats.
P < 0.05 versus respective gender in control.
