FIG. 3.
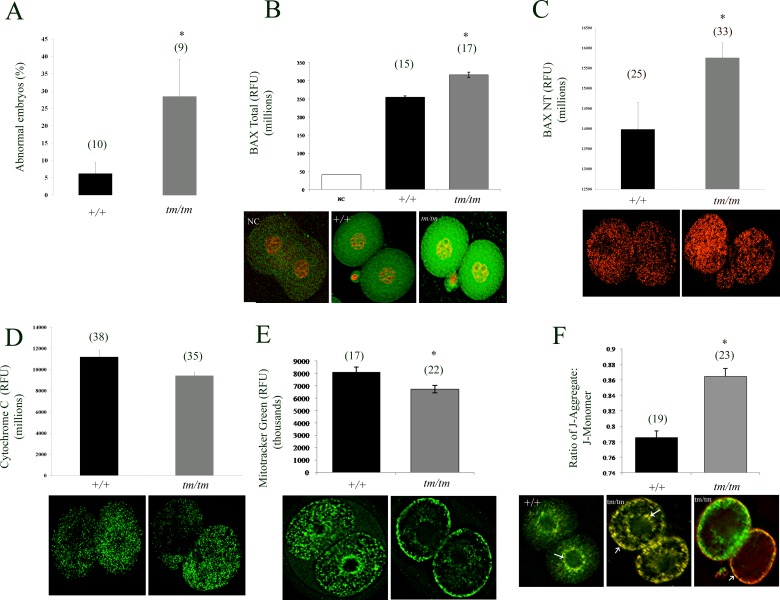
Mitochondrial and molecular changes in two-cell stage embryos. A) Proportion of abnormal embryos retrieved from WT and Nlrp5tm/tm pregnant females retrieved at Day 1.5 from oviducts. Data are shown per female as percentage of abnormal embryos with fragmented or irregular size blastomeres. B, C) BAX protein (total and activated, NT form respectively) expression in Nlrp5tm/tm two-cell embryos. Consistent with the transcript levels, a significant increase in BAX protein was observed in two-cell embryos. Values represent mean fluorescence units ± SEM. Asterisk indicates significance; P < 0.05. D) Cytochrome c level in mutant embryos was decreased by two-cell stage. Values represent sum of fluorescent signal (in RFUs) ± SEM. Asterisk indicates significance; P = 0.049. E) Total mitochondrial pool as measured by Mitotracker Green in Nlrp5tm/tm two-cell embryos. Representative images are shown below the graph. Values represent sum of fluorescent signal (in RFUs) ± SEM. Asterisk indicates significance; P = 0.007. (F) Mitochondrial membrane potential as measured by JC-1 dye in Nlrp5+/+ and Nlrp5tm/tm two-cell embryos. Values represent ratio of J-aggregate (red) to J-monomer (green) ± SEM. Asterisk means values are significant, P < 0.05. Representative images are shown below the graph. Original magnification ×200. Numbers in parentheses represent number of oocytes per group. For generation of graphs and statistics, negative control (NC) values were subtracted from total RFUs.

