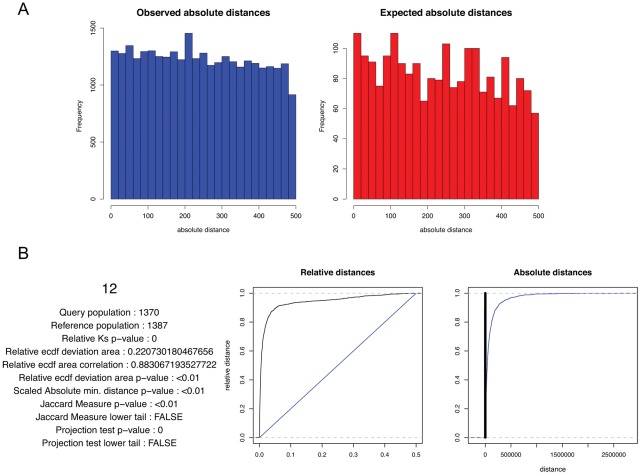
Figure 5. A toy example of absolute distance correlation.
(A) Histograms of the observed and expected ranges of minimum distances between the reference and query. (B) GenometriCorr's simple plot for the same data. Query and reference colors as in Figure 1.

