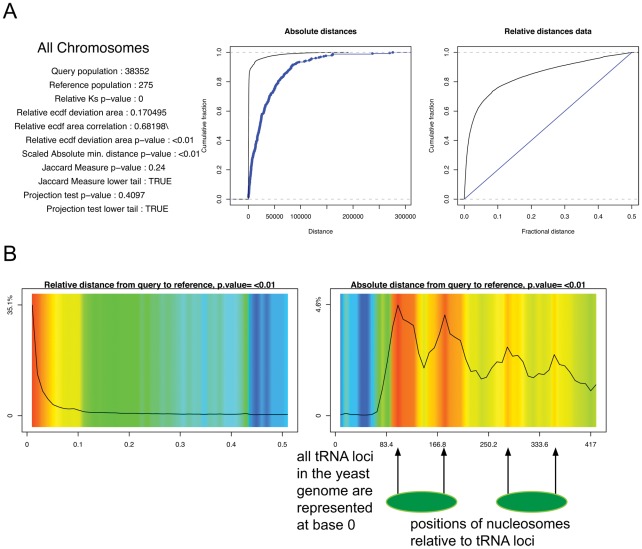
Figure 8. Ty1 retrotransposon insertion sites vs tRNA genes in the yeast genome.
(A) ECDF plots (B) Graphic display. Arrows mark Ty1 insertion sites at nucleosome-occupied positions near tRNA genes. Nucleosomes are in green. The colored graph contains several regions of high observed/expected Ty1 insertions (red colors), and the black line indicates a high density of Ty1 insertions, as well, in these regions. Relative to the tRNA position, the Ty1 insertion sites are most dense inside the nucleosome occupied regions. Query and reference colors as in Figure 1.

