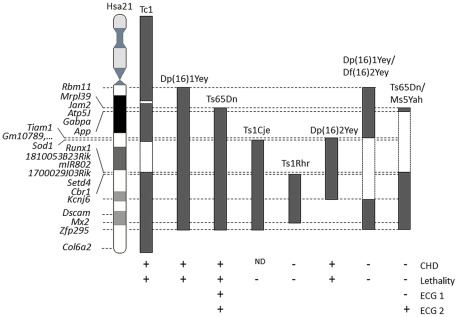
Figure 7. Representation of the DS mouse models displaying lethality and cardiac features.
The position of the trisomic segment with the homologous regions to Hsa21, or the Hsa21 regions found in Tc1, is indicated in grey black blocks. While the disomic segments in compound mutants Dp(16)1Yey/Df(16)2Yey or in Ts65Dn/Ms5Yah or the deleted segments in Tc1 are indicated in dashed boxes. “+” indicates the presence and “−” the absence of phenotypes whereas ND indicates a non-determined state for presence or absence of CHD in Ts1Cje. References are given in the text.

