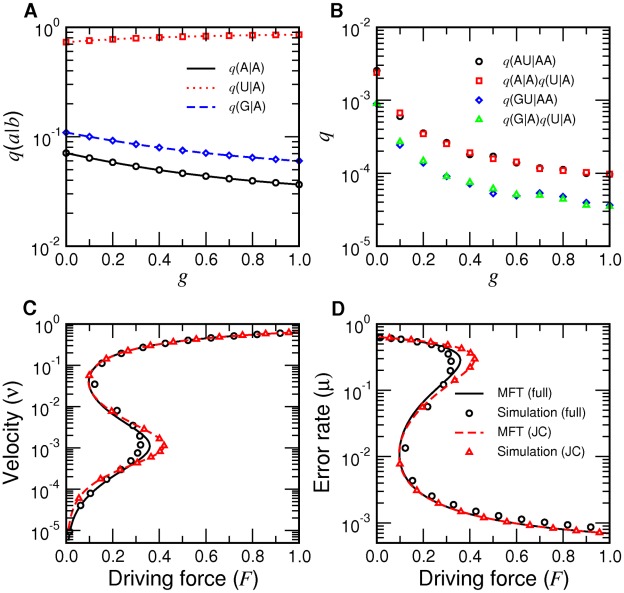
Figure 3. Numerical tests of mean field theory.
A: Three components of  as functions of
  for a symmetric template model for which the mean field theory is exact. The rates were given by
  ,
,  ,
,  , and
, and  for
for  A, U, G, C. Lines are from Eq. (40). Symbols are from numerical simulations. B: Test of site-independence for the sequence distribution, Eq. (35), with pol
  rates (Table 2F). All symbols were calculated from numerical simulations. C–D: Mean velocity (C) and error rate (D) for the pol
  kinetics, both with full experimental kinetics (Table 2) and Jukes-Cantor version (JC) derived from the full kinetic set. Symbols are from simulations, which verify that for JC kinetics the mean field prediction is exact.

