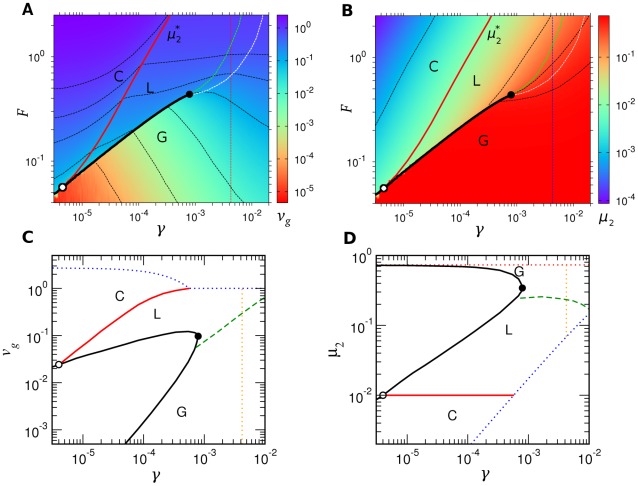
Figure 5. Thermodynamic phase diagrams of RNA replication.
A–B: The  -
- diagrams with color levels and contours (black dashed lines) representing
  (A) and
  (B). The black solid lines show the spinodal terminated by the critical point (filled circles). The red solid lines show the L-C transition for
  and
and  , which meets the spinodal at the triple point (open circles). The white dashed lines show the boundary of
  region (smaller
  side). The green dashed lines show the analogous region of
  values for starvation processes (
 ). The vertical lines show the location of the nonenzymatic
  value. C–D: The
  -
- and
and  -
- diagrams. The green dashed lines represent the
  boundary. The blue dotted lines give the maximum and minimum
  and
and  , respectively, and the red dotted line in D denotes the maximum error rate at equilibrium. The fitness
  is in units of
  .
.

