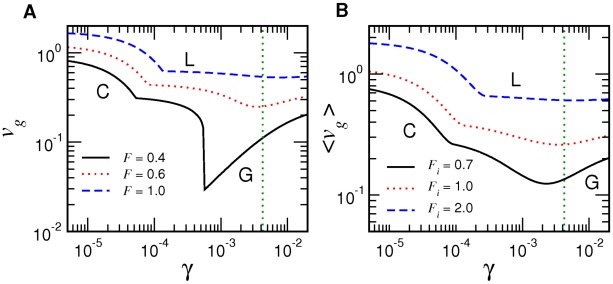
Figure 6. Dependence of mean fitness on fidelity.
A: Mean fitness as a function of  at constant
  . The slope
  is negative below a threshold
  for each
  (white dashed lines in Figure 5A,B and green dashed lines in Figure 5C,D, respectively). The discontinuous jump for
  and the cusps at smaller
  values correspond to G-L and L-C transitions, respectively. B: Mean fitness averaged over starvation processes (
 ) for different initial thermodynamic force
  (see Figure 10). The slope
  is negative below a threshold
  for each
  (green dotted lines in Figure 5A,B). Vertical lines represent the nonenzymatic fidelity. The fitness
  is in units of
  .
.

