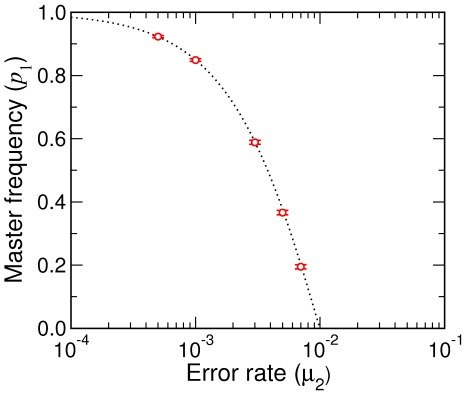
Figure 8. Stationary frequency of master sequence.
Stochastic simulations results for the Eigen model are compared with  . The simulations were under the condition of (approximately) constant population size (
 ) using Eqs. (23). With
  and
and  , the error threshold where
  is at
is at  . Error bars represent one standard deviations.

