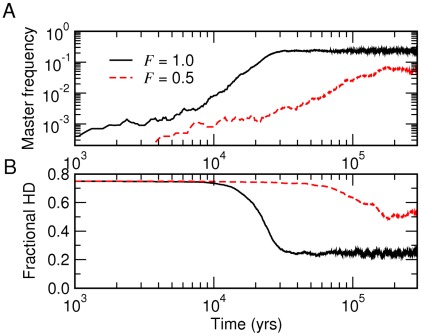
Figure 9. Crystallization of a genome.
Stochastic simulations were used with genome length  and mean base incorporation rate
  . The initial population (
 ) contained random sequences and a single master sequence with relative fitness
  . The inverse fidelity was given by Eq. (25) with
  and
and  . A: Relative frequency of the master sequence (initially
  ). B: Average of the fractional Hamming distance (HD;
  initially).

