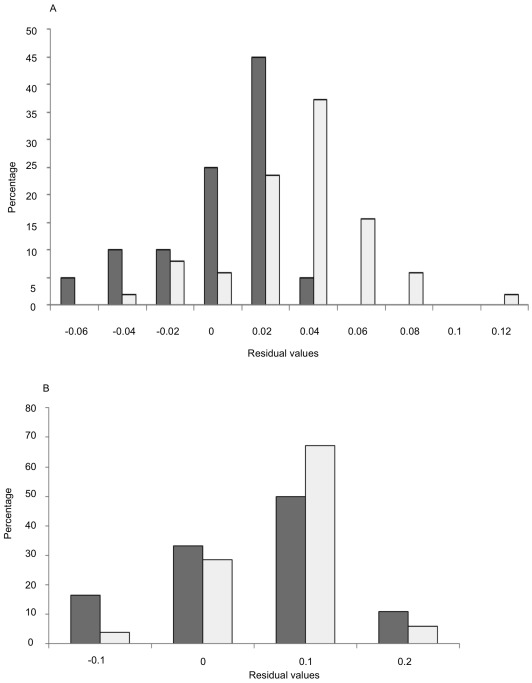
Figure 3. Distribution histograms for traits residuals of female head size (A) and female bill width (B).
Solid bars indicate individuals at the range core (within the 50 km radius of Johannesburg), and open bars indicate individuals at the range margin (beyond 300 km but excluding individuals from the Durban population).

