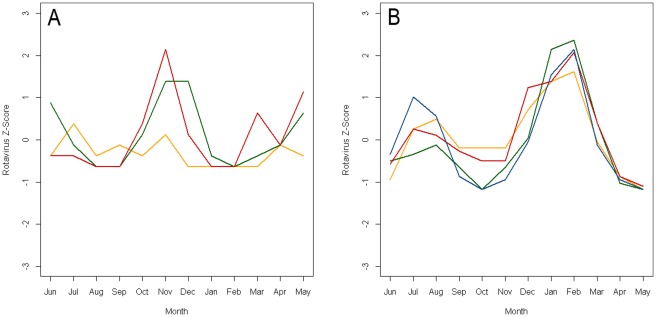
Figure 4. Annual time series of rotavirus z-score superimposed for years of the study for two locations.
Panel A is data for a study conducted in Chandigarh, India [44] and Panel B is data for a study conducted in Matlab, Bangladesh [65]. Data are shifted by 6 months in order to center the winter peaks.

