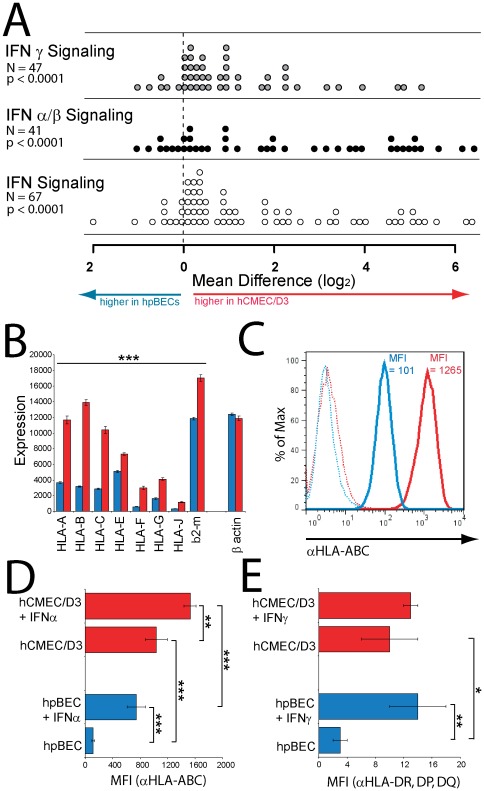
Figure 2. Induction of INF-stimulated genes in immortalized BECs.
( A ) Expression levels of total IFN, IFNα/β and IFNγ signaling pathway genes were determined by microarray analysis for the two BEC lines. Each circle represents one gene of the indicated reactome pathway and the difference in expression between hCMEC/D3 and hpBEC cells. To compare IFN signaling reactomes between BEC lines, the values of the four replicates were averaged, and the probe-set with the highest value was used to represent each gene. The distributions of the genes within each gene set were compared with a one-sample t-test, to test whether the mean of the distributions were different from zero. ( B ) HLA class I, b2-microtublin and β actin gene expression in resting hCMEC/D3 (red bars) and hpBECs (blue bars) determined by microarray analysis. All displayed HLA class I and b2-microtublin genes were significantly (p<0.001) higher expressed in the hCMEC/D3 cells. ( C–E ) Flow cytometry analysis of surface expression of ( C & D ) HLA class I and ( E ) II molecules on hCMEC/D3 cells (red histograms, red bars) and hpBECs (blue histograms, blue bars). ( C ) The HLA class I expression levels and the mean fluorescence intensities (MFI) on both resting BEC lines, in one of four similar experiments, is presented. ( D ) The effect of IFNα upon HLA class I surface expression and ( E ) the effect of IFNγ upon HLA class II surface expression on the two BEC lines are displayed as average MFIs of three similar experiments. *p<0.05, **p<0.01 and ***p<0.001 (Student's t-test).

