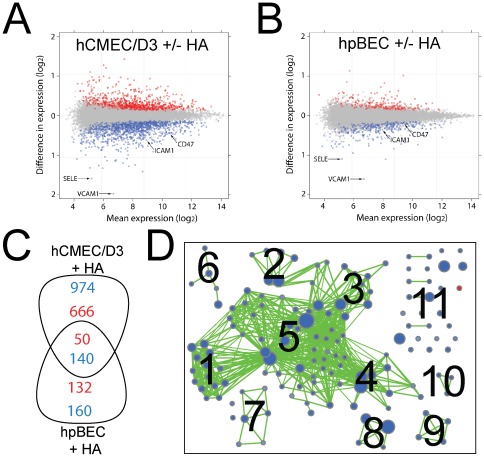
Figure 3. Astrocytic co-culturing reduced the expression of adhesion molecules.
The expression of genes in ( A ) hCMEC/D3 and ( B ) hpBECs was compared in presence and absence of human astrocytes (HA). The data is represented as a dot plot on a log2 scale, where each point represents a probe set on the gene chip. Red and blue dots indicate probe sets, which are differently expressed (adjusted p≤0.05) between culturing conditions. Blue dots represent lower and red dots higher expressed probes in the co-culturing conditions with HAs versus culturing the BECs alone. The mean expression values are averaged expression values for both cell lines. ( C ) Overlapping genes identified between the two BECs in the co-culturing conditions with HAs. The numbers of up-regulated (red numbers) or down-regulated (blue numbers) genes in the BECs with HA co-culture are displayed. ( D ) The enrichment map displays the differently expressed gene sets for hCMEC/D3 cells between culturing conditions. Blue node color represents lower expression in hCMEC/D3 + HA, whereas red represents higher expression in hCMEC/D3 control. Node size is proportional to the number of genes in the gene set and edge thickness represents the degree of overlap between two gene sets. Labels for the clusters of functionally related gene sets were manually assigned: 1) Regulation of Immune Cell Activation and Proliferation, 2) Regulation of Kinase Cascade, 3) Regulation of Inflammatory and Defense Response, 4) Response to Pathogens, 5) Regulation of the Immune System, 6) Response to Cytokines, 7) Regulation of Cell-Cell Adhesion, 8) Cell Migration, 9) Signal Transduction, 10) Antigen Processing and Presentation, 11) Miscellaneous.

