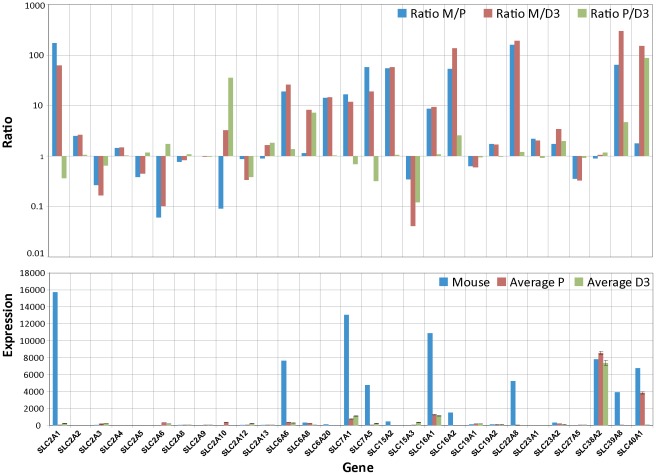
Figure 6. Differences in expression levels of SLC transporter between cultured BECs and freshly isolated BECs.
The RPL4 normalized mouse expression values (Mouse) are compared to the also RPL4 normalized expression values of hpBECs (Average P) and hCMEC/D3 (Average D3). The lower graph shows the absolute expression levels for each cell type. The upper graph shows the ratio between RPL4 normalized mouse BECs and hpBECs (Ratio M/P), the ratio between RPL4 normalized mouse BECs and hCMEC/D3 (Ratio M/D3) and the ratio between hpBECs and hCMEC/D3 (Ratio P/D3). For instance genes that are expressed in much lower levels in both hpBECs and the hCMEC/D3 cell line are GLUT1, MCT8 and OAT3.

