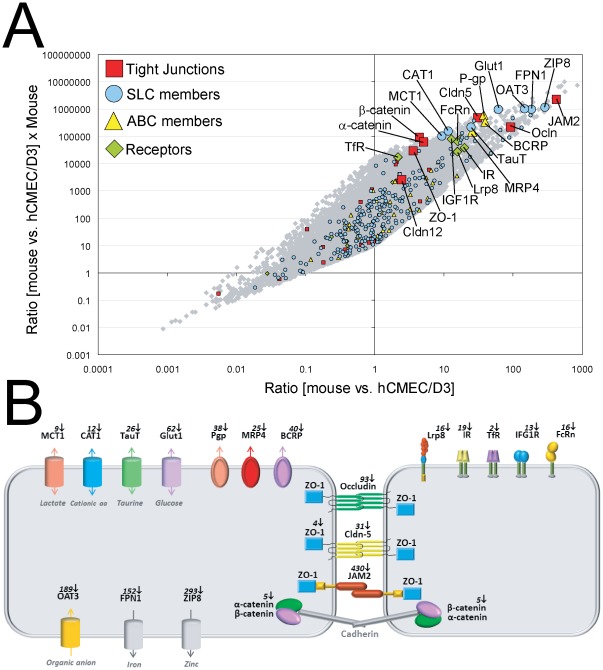
Figure 8. Key BBB genes are expressed at low levels in cultured human BECs.
( A ) All genes for mouse BECs versus hCMEC/D3 are displayed as grey dots. Tight junction genes (red square), SLC members (blue dot), ABC members (yellow triangle) and the surface receptors (green diamond) are highlighted. The x-axis shows the ratio between mouse and hCMEC/D3 and the y-axis shows the ratio between mouse BECs and hCMEC/D3 multiplied by the expression levels in mouse BECs. Genes in the upper right corner are therefore highly expressed in mouse BECs and much more in comparison to the hCMEC/D3 cell line. The graph shows that all key BBB genes are expressed at lower levels in the human cell line hCMEC/D3 (enlarged symbols). A similar result was obtained when comparing the mouse expression data to the hpBECs. ( B ) A schematic representation of the key genes identified in this study to have low level of expression in the hCMEC/D3 cells. The picture illustrates the spatial location of the BBB genes on BECs and the fold reduction in expression compared to mouse BECs.

