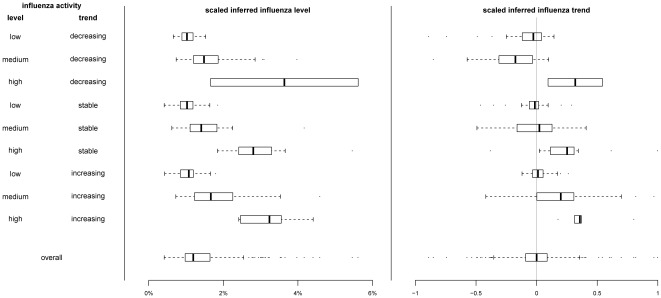
Figure 3. Box-plot of inferred influenza level and trend based on multivariate dynamic linear model utilizing four surveillance data streams including influenza-like illness consultation rates in public General Outpatient Clinics (GOPC) and private general practitioners (GP), school absenteeism rates, and number of consultations with patients with febrile illness in Designated Flu Clinics, under different patterns of influenza activity.
Influenza activity was defined as low, medium or high if it is lower than 0.4%, between 0.4–2.5%, or higher than 2.5% respectively, defined as decreasing, stable or increasing if the percentage change between the following and preceding week is lower than −40%, between −40–40% or higher than 40% respectively. The inferred influenza level was scaled to the range of the influenza activity proxy measure (product of laboratory influenza isolation rate and GP ILI rate), while the inferred trend of influenza activity under the same model was scaled to the range [−1, 1].

