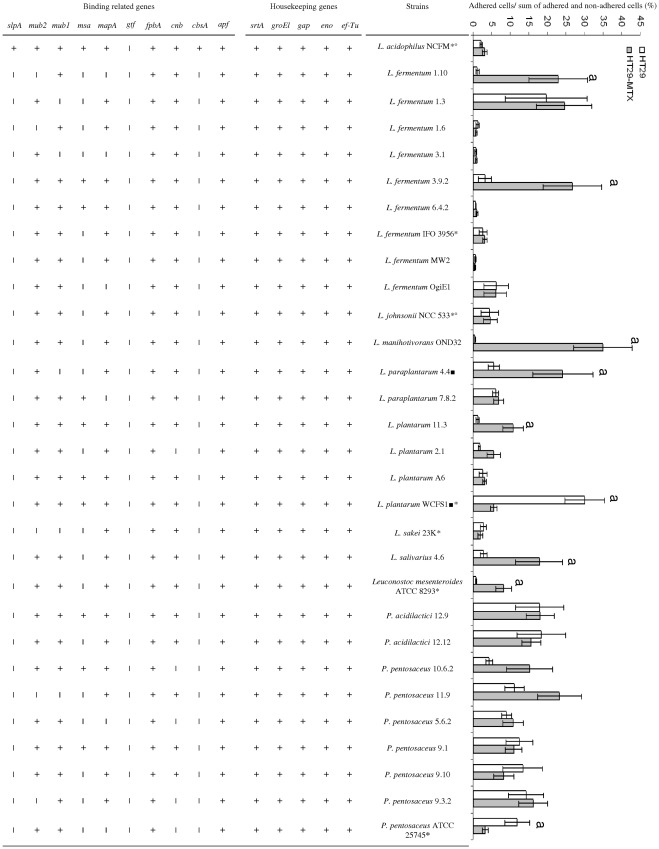
Figure 2. Ratio of adhered cells to the sum of adhered and non-adhered cells after 2 h incubation at 37°C and the distribution of genes involved in binding to the gastrointestinal tract in the 30 selected LAB.
Results are the means ± SD of three independent assays. The ratio of bacteria bound to non-mucus secreting cells (HT29) is in white. The ratio of bacteria bound to mucus secreting cells (HT29-MTX) is in gray. The general role of the gene is indicated at the top left of the line. The absence of a gene is indicated by a “−” and its presence by a “+”. Asterisks indicate sequenced strains of LAB, circles indicate commercial probiotic strains, and squares the strains selected for transcript analysis. Letters indicate a statistical difference in the ratio between the two cell lines (p<0.05, Student-Newman-Keuls test).

