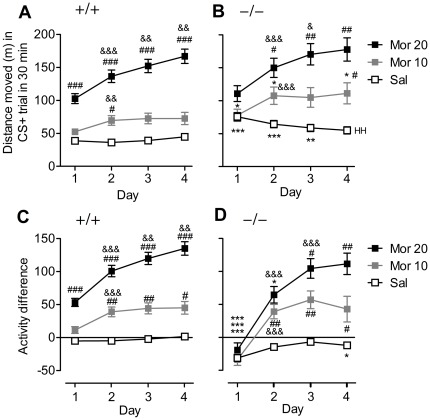
Figure 2. Morphine-induced locomotor sensitization in GluA1−/− and GluA1+/+ mice.
(A–B), Distance moved in the CS+ (morphine, or saline for saline control animals) trials is shown. The scores indicate 1) significant morphine effects and dose-response (# p<0.05, ## p<0.01, ### p<0.001, compared to the previous dose, Bonferroni test), 2) significant locomotor sensitization to morphine (& p<0.05, && p<0.01, &&& p<0.001, compared to the previous day, Bonferroni test), 3) significant habituation in GluA1—mice (saline control group) (HH p<0.01, compared to the first trial, Bonferroni test). Data represent means ± SEM, n = 24–49. * p<0.05, ** p<0.01, *** p<0.001, between the genotypes, t-test. The scores were derived from the raw data depicted in Fig. 1. (C–D), The difference in distance moved between trials 1 and 2 (CS+ minus CS−) on each conditioning day. The data indicate 1) that the activity of GluA1−/− is strongly reduced, in comparison to GluA1+/+ mice, during the second trial of the first conditioning day after both saline control and morphine injections (* p<0.05, ** p<0.01, *** p<0.001, between the genotypes, t-test), 2) that during the following days, GluA1−/− and GluA1+/+ mice were equally activated by 10 mg/kg morphine and 3) that morphine 20 mg/kg produced incremental locomotor activity in both mouse lines (# p<0.05, ## p<0.01, ### p<0.001, compared to the previous dose, Bonferroni test). Data represent means ± SEM, n = 24–49. The scores were derived from the raw data depicted in Fig. 1.

