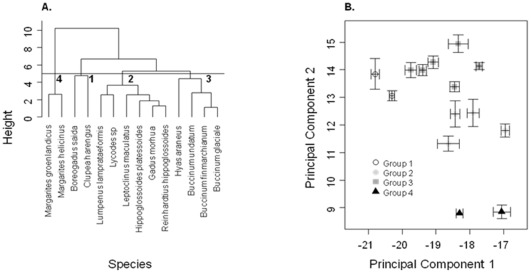
Figure 5. Results of the Cluster Analysis on the 14 potential prey species showing (a) the dendrogram indicating the 4 principal groups, and (b) the mean (±95% confidence limits) δ 13C and δ 15N values for each of the prey species.
The different colours indicate prey groups assigned by the cluster analysis.

