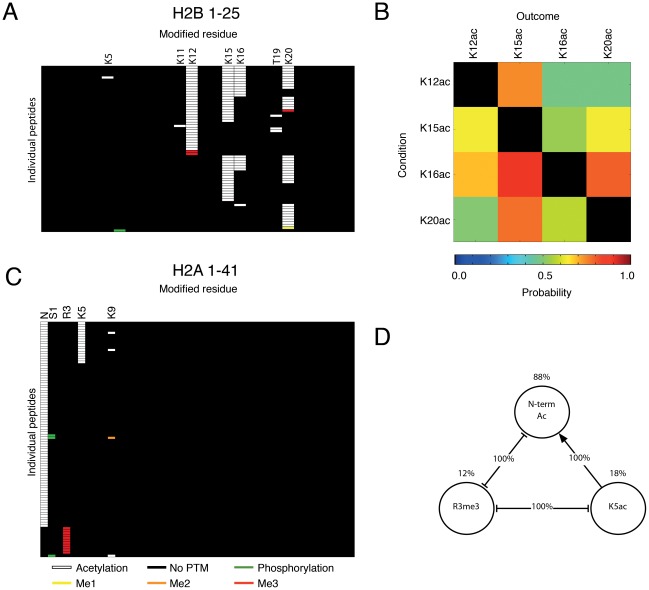
Figure 3. Combinatorial patterns on H2A and H2B.
Summary of N-terminal H2B and H2A combinatorial codes identified using ETD-MS. Each line represents an individual H2B1–25 (A) or H2A1–41 (C) peptide. Probability of co-occurrence of individual PTMs on H2B1–25 determined by an association rule data-mining algorithm (B). The condition (left rows) is when a specific PTM is observed on H2A/H2B, and the outcome (top columns) is the probability (indicated by a heat plot) that a second or several PTM(s) are observed at the same time on the same histone molecule. Diagram depicting the relationship between three PTMs on H2A1–41 (D). N-term Ac, K5ac and R3Me3 were either mutually exclusive or always seen in combination. The frequency of each PTM is indicated by the % above the circle, connections indicate the derived rule and its % occurrence. For instance, when K5ac was present, N-term ac was also observed in 100% of cases (connected by arrow), but R3me3 was never observed. When R3me3 was observed, N-term acetylation or K5ac was never observed (100% of cases), suggesting mutual exclusion of N-term acetylation and R3me3, potentially due to steric hindrance or conformational changes induced by each PTM.

