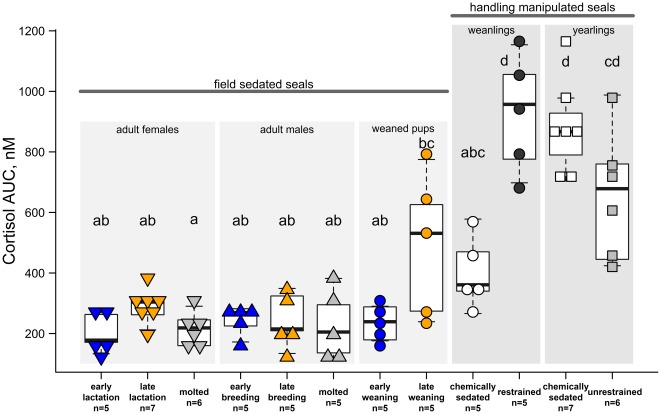
Figure 4. Cortisol AUC value for each study group.
The total cortisol present during the sampling period (cortisol AUC) for each study group; symbol and color coding matches that of Figure 3. Groups without overlapping letters were significantly different (p<0.05). See text and Table 1 for additional descriptions of study groups. Central horizontal lines indicate median of each group; whiskers extend to data points within 1.5 times the interquartile range from each box.

