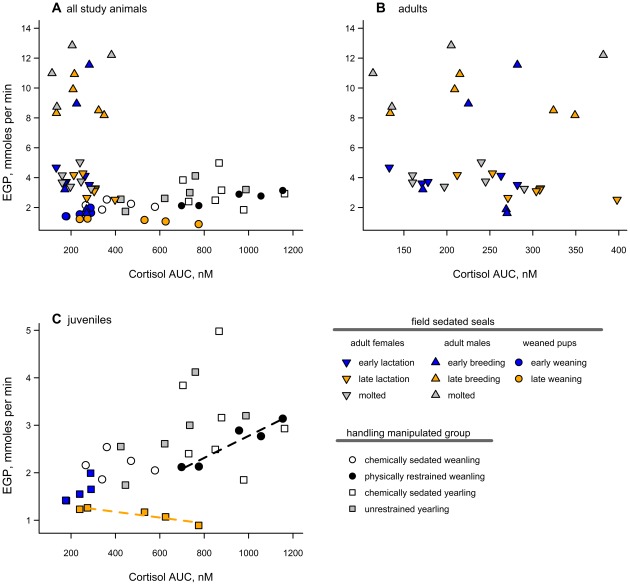
Figure 7. Relationship between EGP and cortisol levels.
EGP did not vary with cortisol release among all study groups (F1, 14.7 = 1.0, p = 0.33). Note that the axes are not consistent between graphs, A) all study animals shown; B) adults, and C) juveniles, because the handling manipulated seals had a much larger range in cortisol AUC values than did field sedated seals. Dashed lines in C) indicate significant trends within the physically restrained and late weaning groups alone.

