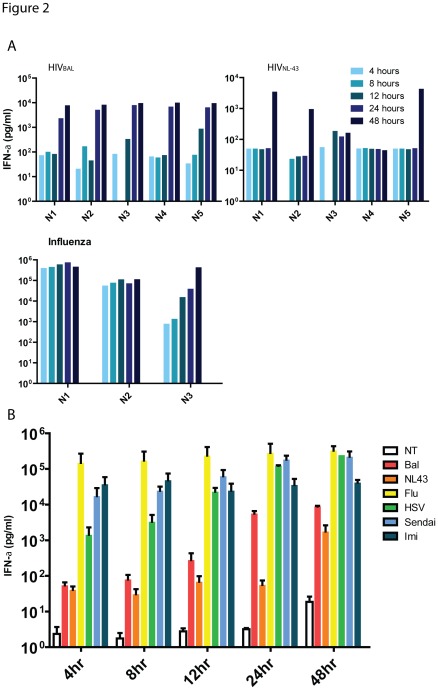
Figure 2. Kinetics of IFN-αproduction.
Isolated pDCs from five HIV negative donors were rested overnight, and treated with a panel of stimuli as described in the materials and methods. Levels of IFN-α in supernatants were quantified by CBA as part of a panel of other cytokines. (A) Quantified IFN-α (pg/ml) present in culture supernatant of 3–5 donors (N1-N5) at various time points (represented by blue shaded bars) following stimulation by HIVBAL, HIVNL43 or Influenza (B) Mean ± SEM concentrations of IFN-α present in supernatants at various time points following stimulation by HIVBAL, (red), HIVNL43 (orange), Influenza (yellow), HSV-1 (green), Imiquimod (light blue), Sendai virus (dark blue), and medium control (white) from data from 5 donors.

