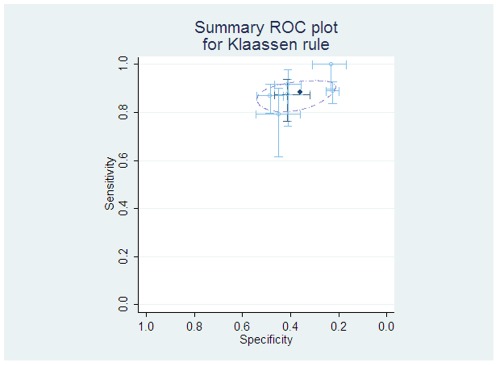
Figure 2. Individual and pooled diagnostic test accuracy of ‘Klaassen’ rule.
The ROC space plots show each study estimates of sensitivity and specificity as a marker at the point estimate, with 95% confidence intervals demonstrated by lines. In reading such graphs, tests with a better discriminatory ability fall in the top left corner of the plot, and non-discriminatory tests fall on a 45° line between the bottom left and top right. The light lines and circles represent individual studies, with the darker dashed lines showing the study from which the rule was derived. The dark circle is the pooled estimate of sensitivity and specificity, and the dashed ellipse represents the bivariate 95% confidence intervals of this result.

