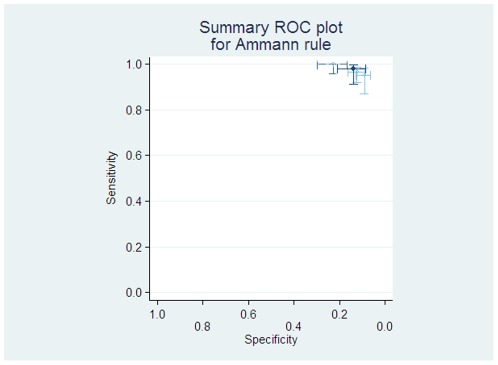
Figure 3. Individual and pooled diagnostic test accuracy of ‘Ammann’ rule.
The ROC space plots here has the light lines and circles represent individual studies, with the darker dashed lines showing the study from which the rule was derived, and the heavy dark lines the pooled estimate of sensitivity and specificity, with the univariate 95% confidence intervals.

