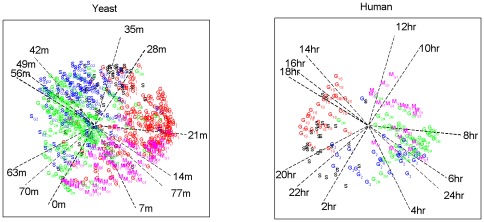
Figure 5. Common cell cycle space as found with the adapted GSVD.
Both the time points and the cell cycle annotated genes are displayed with respect to the first two common components. The time points are displayed as oriented vectors; the genes as labelled points. The gene labels refer to phases of the cell cycle: M (magenta), M/G1 (magenta), G1 (red), G1/S (red), S (black), S/G2 (blue), G2 (blue), G2/M (green).

