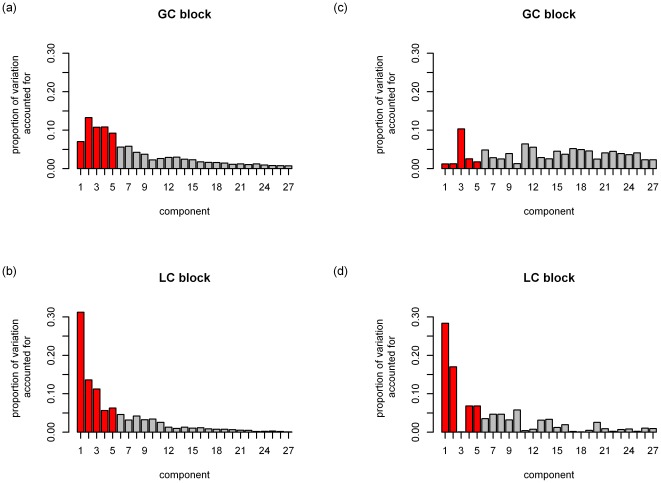
Figure 7. Proportion of variation accounted for in each data block.
Panel (a): by SCA for the GC data; panel (b): by SCA for the LC data; panel (c): by GSVD for the GC data; panel (d): by GSVD for the LC data. For each method, the components are ordered according to the VAF in the concatenated data. The bars for the rank 5 approximation are coloured in red.

