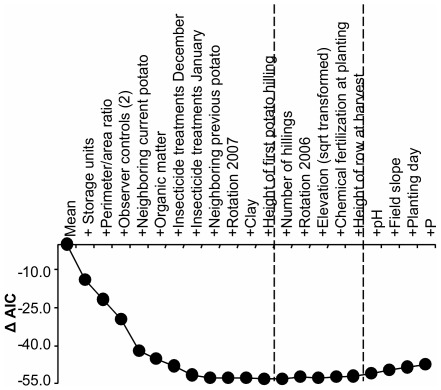
Figure 5. Forward stepwise development of the global (least parsimonious) statistical model explaining Andean potato weevil infestations.
The x-axis shows the progressive addition of explanatory variables in order of their contributions to lowering AIC. The y-axis shows cumulative reductions in AIC from the AIC associated with using only the mean to estimate infestations. The first dashed line shows the point where the addition of variables started to penalize the AIC, whereas the second dashed line shows the point where this penalty started to exceed two AIC values. The global model included all variables before the second dashed line.

