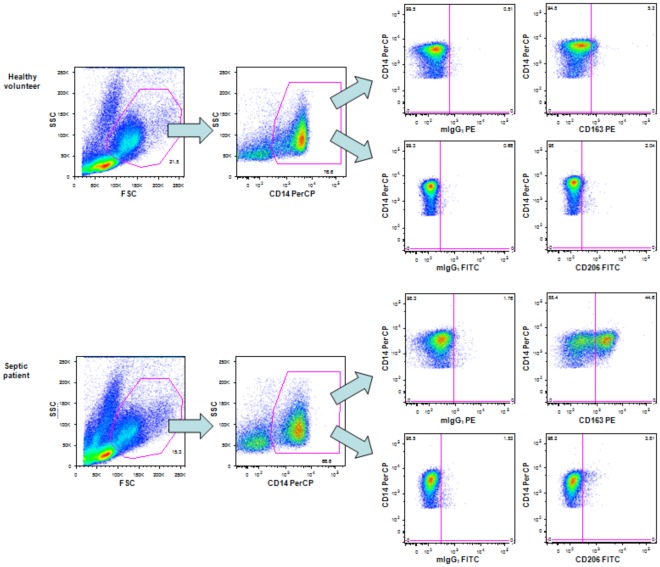
Figure 3. Strategy for the analysis of alternatively activated monocytes.
Dot plots shown are representative of one healthy volunteer and one septic patient. Twenty thousand events were acquired based on forward scatter versus side scatter parameters and CD14-positive stained cells. The percentages of cells expressing CD163 or CD206 were determined with quadrants based on the isotype controls.

