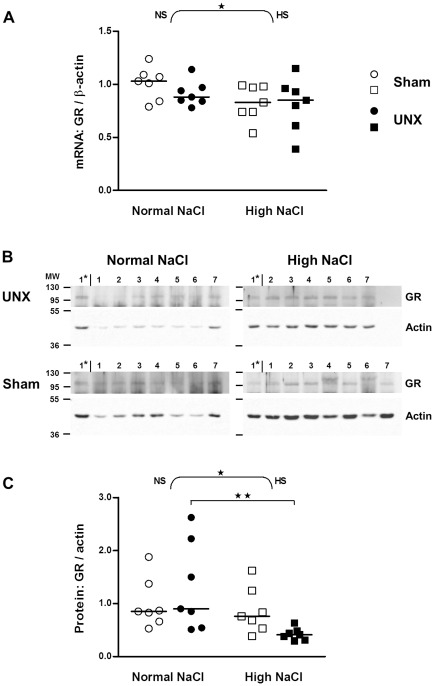
Figure 4. Impact of salt intake on glucocorticoid receptor expression in the colon of control and UNX rats.
A: mRNA expression in epithelial cells isolated from colon (real-time PCR). Values were normalized with endogenous β-actin mRNA expression. Results were quantified relative to the mean of the sham-operated, normal salt group. B: Western blots showing protein in epithelial cells isolated from colon. Lanes 1–7: Rat colon samples; Lane 1*: Sample 1 of UNX high NaCl group was loaded on each gel as a standard for comparison between blots; MW: molecular weight. C: Amount of proteins relative to control rats (sham-operated, normal salt). Bands quantified as in Figure 2. The horizontal line is the median (n = 7). ★, P≤0.05 indicates the effect of salt analyzed by two-way ANOVA (curly brackets; NS: normal salt; HS: high salt). ★★, P≤0.01 indicates a significant difference between the UNX normal salt and UNX high salt group (squared bracket, Bonferroni's post test).

