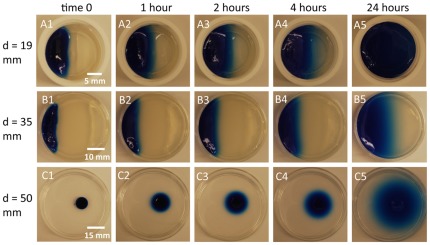
Figure 4. Visualization of diffusion in different experimental settings.
The three different sized chambers (19 mm, 35 mm and 50 mm) were set up as described in the methods except that the 100 mM sucrose was substituted with 1% agarose with 1% ethanol, 0.025% w/v Bromophenol Blue and 0.025% Xylene Cyanol. The molecular weights of these dyes are approximately twice that of sucrose so these dyes will underestimate the diffusion of sucrose. The photos were taken at time points 0, 1, 2, 4 and 24 hours.

