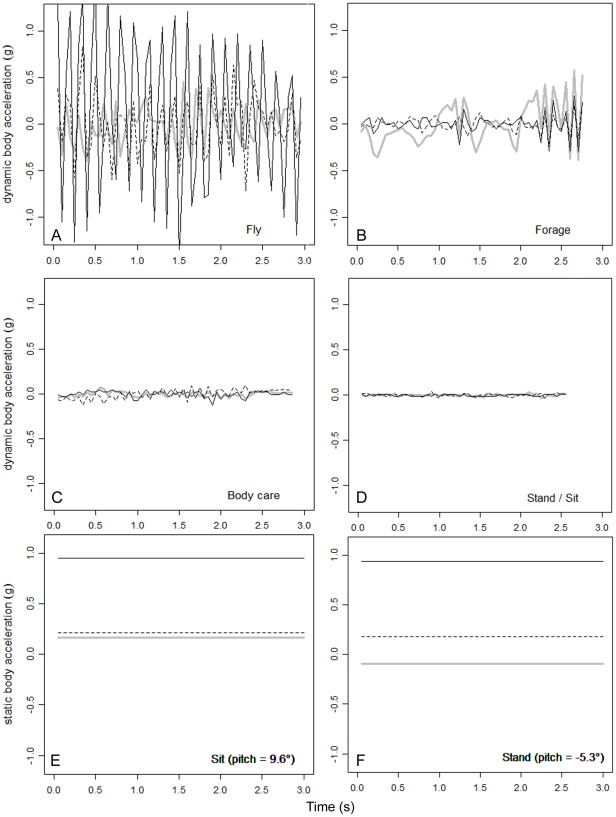
Figure 5. Examples of behaviours with characteristic signals from dynamic acceleration and static acceleration.
Characteristic signals from dynamic acceleration (A–D) and static acceleration (E–F) are shown. In all panels, acceleration in the surge (X) axis is shown with a continuous grey line, in the sway (Y) axis with a dashed line and in the heave (Z) axis with a continuous black line. Fly and forage (A, B) are especially characterized by high-amplitudes of all dynamic acceleration components, but the frequency of the signals is higher for fly than it is for forage (especially in the Z direction, see dpsZ in Figure 4). Many of the accelerometer signals for foraging are characterized by the alternation between relatively smooth lateral movement (changes in acceleration predominantly in the surge axis) and short bursts of high frequency changes in acceleration in all three axes (e.g. catching prey, at 2.2 s panel B, see also Video S1). The changes in dynamic acceleration for body care (C) are much smaller than for fly and forage, but still considerably higher than for stand and sit (D, see also odbaX and odba in Figure 4). The static acceleration can be used to distinguish sit (E) and stand (F) due to differences in body posture (see pitchX in Figure 4).

