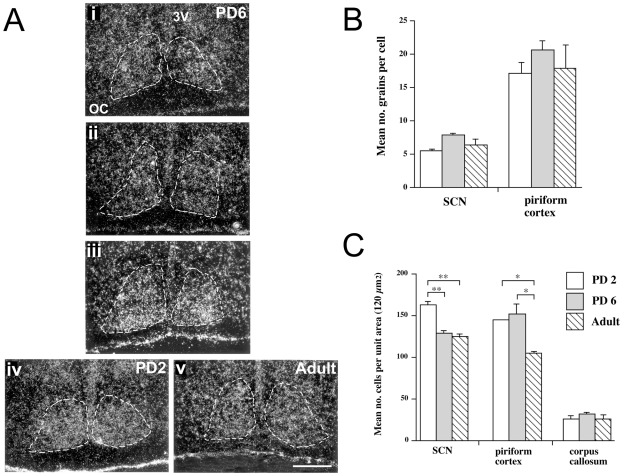
Figure 6. Assessment of NR1 probe hybridization by emulsion autoradiographs.
(A) Dark-field photomicrographs from emulsion autoradiographs of C2 probe, depicting NR1001 (NR1-2a) receptor mRNA in PD2, PD6 and Adult Siberian hamster SCN. (i), (ii) and (iii) represent the rostral, medial and caudal SCN respectively at PD6. (iv) shows the medial SCN at PD2, and (v) shows the medial SCN in the adult. The region of the SCN is surrounded by dotted lines, and these were generated from describing the SCN region in corresponding Nissl-stained sections viewed under bright-field. OC, optic chiasm; 3 V, third ventricle. Scale bar = 200 µm. (B) Assessment of silver grain densities over SCN and piriform cortex cells on emulsion-dipped PAN probe hybridized sections. Mean ± SEM for number of grains per cell as measured in 120 µm2 area on brain sections from PD2 (white bars; n = 5), PD6 (grey bars; n = 5) and adult (hatched bars; n = 3) hamsters. (C) Assessment of cell density in the SCN, piriform cortex and corpus callosum on emulsion-dipped sections hybridized with PAN probe. Mean ± SEM for number of cells per 120 µm2 area on brain sections from PD2 (n = 5), PD6 (n = 5) and adult (n = 3) hamsters. *P<0.05 and **P<0.01 when cell density is age compared for groups (Dunnett's post-hoc t-test).

