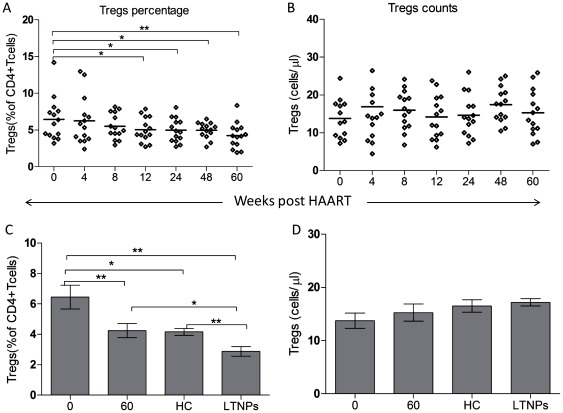
Figure 3. Longitudinal changes in the percentage and counts of Tregs during ART (weeks).
(A–B) Longitudinal changes in the percentage and counts of Tregs in HIV-1-infected patients during ART. (C–D) Comparisons of the percentage and counts of Tregs among HIV-1-infected patients at week 0, week 60, healthy controls and LTNPs. **p<0.01, *p<0.05.

