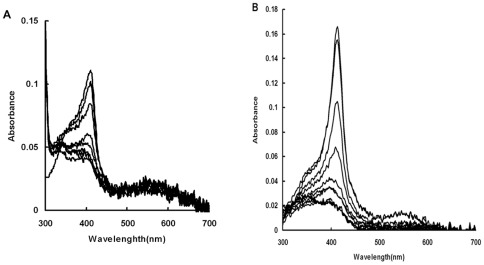
Figure 5. HemS dependent degradation of heme.
(A): 10 mM final concentration of ascorbate was added to the HemS-heme complex (10 µM). The spectral changes from 300–700 nm were recorded every 1 min. (B): Cytochrome P450 reductase was added to 10 µM HemS-heme complex with a 0.3∶1 molar ratio and heme degradation was initiated by adding NADPH 10 µM increments to a final concentration of 100 µM. The spectra were recorded from 300–700 nm after each addition. All Experiments were performed in triplicate and a single representative experiment is presented.

