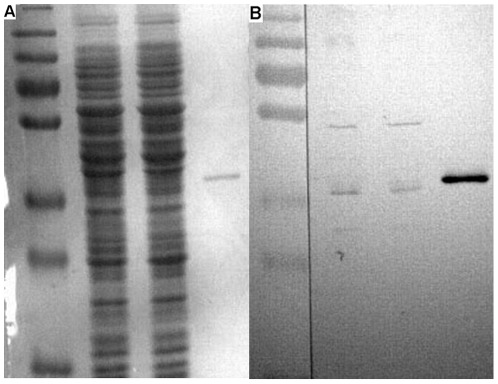
Figure 6. Detection of HemS expression level in B. henselae pNS2Trc and B. henselae pNS2Trc::hemSAS by immunoblotting.
20 µg samples of B. henselae pNS2Trc (1) and B. henselae pNS2Trc::hemS AS (2), 20 ng sample of purified his-tagged HemS (3) were loaded on SDS-PAGE. After electrophoresis, one gel was stained with comassie brilliant blue R (A). Another gel was transferred to a nitrocellulose filter to do immune blotting as decribed in “Materials and Methods” (B). Measurement of HemS band intensity using Image J software gave the following results: B. henselae pNS2Trc: mean gray value: 24, integrated density: 3218; B. henselae pNS2Trc::hemS AS: mean gray value: 14, integrated density: 2075.

