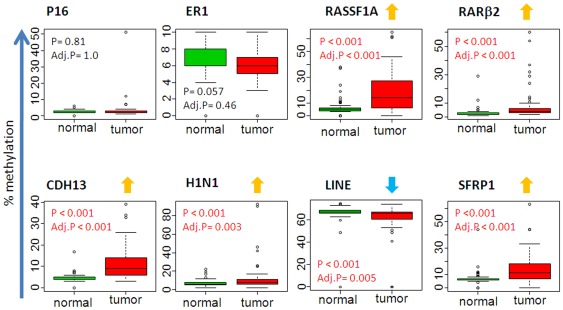
Figure 1. Quantitative DNA methylation analysis in human breast tissues.
The percentage of DNA methylation levels at promoter CpG islands were analyzed in bisulfite-modified genomic DNA extracted from matched pairs of non-cancerous (normal) and breast tumors (tumor) tissue samples obtained from AA and AE cancer patients. Y axis, percentage of methylated cytosines in the samples as obtained from pyrosequencing. X axis, normal and tumor tissues obtained from AA and EA. P value is indicated for each gene (Mann-Whitney). Adj. P: adjusted P value (Bonferroni).

