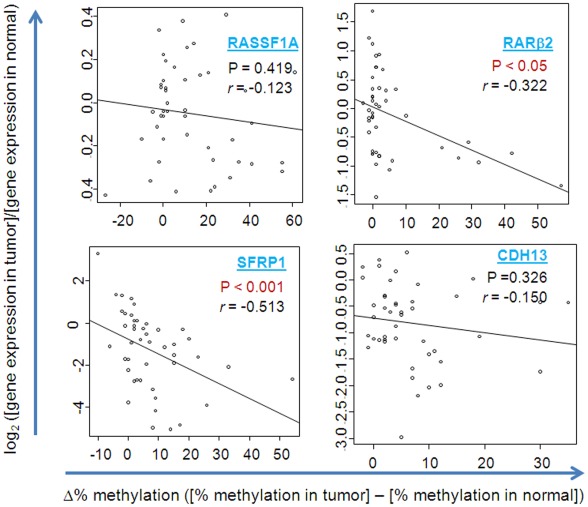
Figure 2. Promoter methylation and gene expression.
The ratio of gene expression data of tumor to non-cancerous (normal) from a genome-wide gene expression microarray [23] was correlated with the methylation difference between the tissue pairs. The log 2 ratio of gene expression in matched pair tumor and normal is shown on Y axis. The relative methylation frequency is shown on the X-axis. P value and the correlation index; r (Rho) values are from Spearman rank correlation analysis.

