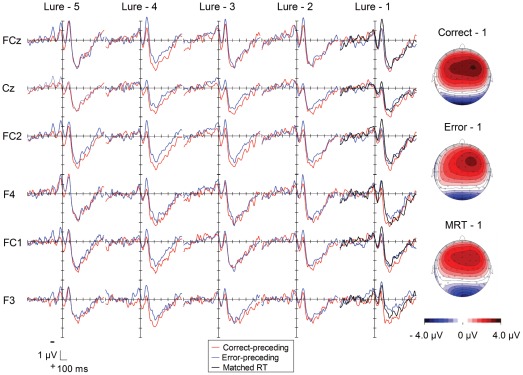
Figure 3. Grand-average waveforms of EMG-locked ERPs as a function of lure-preceding trials (red: correct-preceding, blue: error-preceding trials).
Waveforms are drawn with negative polarity up. Scalp distributions of the positivity following the response (ranging from 199 to 230 ms) are shown for the lure - 1 trials (i.e., correct-preceding, error-preceding, and matched RT trials).

