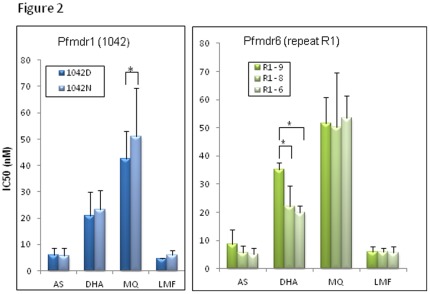
Figure 2. Association of SNPs and other polymorphisms in candidate genes with drug responses.
Only significant association of a SNP in pfmdr1 and number variation of repeat R1 in pfmdr6 with in vitro responses to artesunate (AS), dihydroartemisinin (DHA), mefloquine (MQ) and lumefantrine (LMF) are plotted here. IC50 values are shown as mean + standard deviation. *indicates significant difference (P<0.05) in sensitivity between the two alleles.

