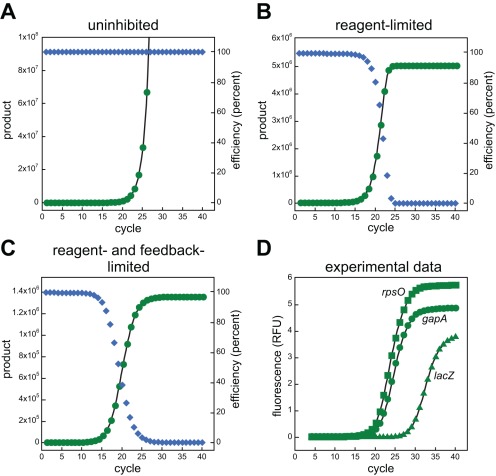
Figure 1. Comparing PCR equations.
In panel A, product formation (green circles) is modeled to accumulate with a perfect, constant efficiency of 100% (blue diamonds) using equation 4 (Information S1). The simulated data was fit using non-linear regression using the same function (black line). Panel B, simulated data of a purely reagent-limited reaction is shown using equation 5 with a maximum product yield of 5×10⁶ (also fit to its function). Panel C, simulated data is shown using the PCR equation 6 with a max value of 5×10⁶ and a Kd value of 5×10⁵. The efficiency terms at each cycle were extracted and plotted as blue diamonds. Panel D shows examples of real qPCR data fitted to equation 6 from amplifications using cDNA libraries generated from total E. coli RNA as templates. The resulting fitting values were: rpsO, max = 25.148, Kd = 1.6798, R2 = 0.99996; gapA, max = 19.56, Kd = 1.5753, R2 = 0.99998; lacZ, max = 16.29, Kd = 1.141, R2 = 0.99996.

